 The American Philosophical Association (APA) puts out an annual Guide to Graduate Programs in Philosophy. The following statistics come completely from aggregating and compiling the data found in the 2013 guide.
Note: All data are self-reported by the departments in question and cannot be guaranteed accurate. Furthermore, this is not a random or necessarily representative sample of philosophy programs as it contains information from only those schools that completed the 2013 Graduate Guide survey.
Summary of Findings
- CUNY has awarded the most degrees of any school since 2009, a total of 53. That is about 11 per year.
- Nearly 1500 PhDs in philosophy have been awarded by these schools since 2009.
- The average time to complete a PhD in philosophy is about 7 years.
- Claremont Graduate University has the highest average completion at 10 years
- SUNY at Binghamton, McMaster University, and Arizona State University have the lowest average completion at 5 years.
Degrees Awarded and Time to Complete PhD
This data spans the years 2009-2013.
Number of Degrees Awarded (Total and Average)
- The most degrees awarded 2009 – 2013 by school are (1) CUNY Graduate School and University Center at 53, (2) University of Notre Dame at 46, and (3) University of Toronto at 40 degrees.
- The highest average of degrees awarded 2009-2013 by school are (1) CUNY Graduate School and University Center at 10.6, (2) University of Notre Dame at 9.2, and (3) Stony Brook University at 8.5 degrees/year (Note: no data for Stony Brook University in 2013).
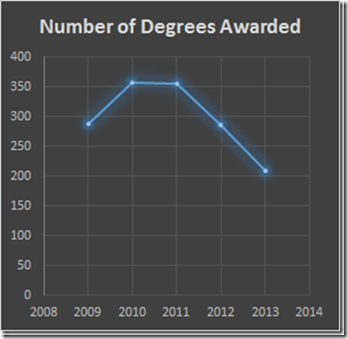
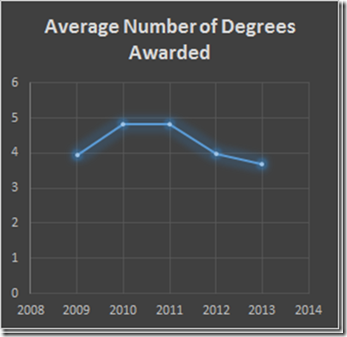
- Total of 1499 degrees awarded, an average of 4.28 per school per year, from 2009-2013.
Here is each school’s numbers:
| School | Total Degrees Awarded Over Period | Average of Degrees Awarded Per Year Over Period |
| Total/Average | 1499 | 4.28 |
| CUNY Graduate School and University Center | 53 | 10.6 |
| University of Notre Dame | 46 | 9.2 |
| University of Toronto | 40 | 8 |
| Boston College | 37 | 7.4 |
| University of Texas at Austin | 36 | 7.2 |
| University of Wisconsin-Madison | 36 | 7.2 |
| Stony Brook University | 34 | 8.5 |
| University of Michigan-Ann Arbor | 34 | 6.8 |
| Rutgers University-New Brunswick | 32 | 6.4 |
| Loyola University Chicago | 31 | 7.75 |
| Massachusetts Institute of Technology | 30 | 6 |
| University of Arizona | 29 | 5.8 |
| University of Pittsburgh (Philosophy) | 29 | 5.8 |
| Cornell University | 28 | 5.6 |
| Purdue University-West Lafayette | 28 | 5.6 |
| Fordham University | 27 | 6.75 |
| Boston University | 27 | 5.4 |
| Southern Illinois University Carbondale | 27 | 5.4 |
| University of California-Los Angeles | 27 | 5.4 |
| University of South Florida-Main Campus | 27 | 5.4 |
| New York University | 26 | 5.2 |
| University of California, Berkeley | 26 | 5.2 |
| University of California-Riverside | 26 | 5.2 |
| Temple University | 25 | 5 |
| Vanderbilt University | 25 | 5 |
| Emory University | 24 | 6 |
| New School for Social Research | 24 | 6 |
| Stanford University | 24 | 6 |
| Catholic University of America | 24 | 4.8 |
| Pennsylvania State University-Main Campus | 22 | 5.5 |
| Princeton University | 20 | 5 |
| University of Massachusetts Amherst | 20 | 4 |
| University of Virginia-Main Campus | 20 | 4 |
| University of Illinois at Urbana-Champaign | 19 | 4.75 |
| Duquesne University | 19 | 3.8 |
| Indiana University-Bloomington | 19 | 3.8 |
| University of California-Santa Barbara | 19 | 3.8 |
| SUNY at Binghamton | 18 | 4.5 |
| McMaster University | 18 | 3.6 |
| The Ohio State University-Main Campus | 18 | 3.6 |
| Washington University in St. Louis | 18 | 3.6 |
| Duke University | 17 | 3.4 |
| Syracuse University | 17 | 3.4 |
| University of Illinois at Chicago | 17 | 3.4 |
| University of California-Davis | 16 | 3.2 |
| University of Rochester | 16 | 3.2 |
| University of Hawaii at Manoa | 14 | 3.5 |
| William Marsh Rice University | 14 | 3.5 |
| Arizona State University | 14 | 2.8 |
| Bowling Green State University-Main Campus | 14 | 2.8 |
| University of Tennessee-Knoxville | 14 | 2.8 |
| University of Utah | 14 | 2.8 |
| University of Washington-Seattle Campus | 14 | 2.8 |
| Michigan State University | 13 | 2.6 |
| University of British Columbia (UBC) | 13 | 2.6 |
| DePaul University | 12 | 4 |
| Saint Louis University-Main Campus | 12 | 3 |
| University of Miami | 12 | 2.4 |
| University of Oklahoma Norman Campus | 12 | 2.4 |
| University of California-Santa Cruz | 11 | 2.75 |
| University of Dallas | 11 | 2.75 |
| University of Southern California | 10 | 5 |
| Johns Hopkins University | 10 | 3.33 |
| Indiana University (HPS) | 10 | 2 |
| Carnegie Mellon University | 9 | 1.8 |
| University of Alberta | 9 | 1.8 |
| University of Nebraska-Lincoln | 9 | 1.8 |
| University of Pittsburgh (HPS) | 9 | 1.8 |
| University of Waterloo | 8 | 1.6 |
| University of California-San Diego | 7 | 2.33 |
| University of Georgia | 7 | 1.75 |
| Texas A & M University | 7 | 1.4 |
| University of Cincinnati-Main Campus | 7 | 1.4 |
| Claremont Graduate University | 5 | 1 |
| Dalhousie University | 3 | 0.6 |
Here is the aggregation of schools over the 5 year period:
| Year | Number of Degrees Awarded | Number of Schools Reporting | Average Number of Degrees Awarded |
| 2009 | 289 | 73 | 3.95 |
| 2010 | 357 | 74 | 4.82 |
| 2011 | 356 | 74 | 4.81 |
| 2012 | 287 | 72 | 3.98 |
| 2013 | 210 | 57 | 3.68 |
| Grand Total | 1499 | 350 | 4.28 |
Graphically:
Time to Completion (Average):
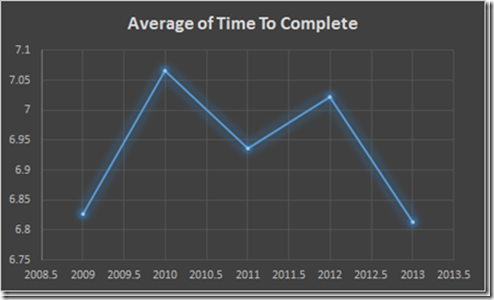
- The Average time to completion is 6.94 years.
- The top 3 schools in terms of highest average time to completion of degree are (1) Claremont Graduate University at 10 years, (2) Syracuse University at 9.6 years, and (3) University of Pittsburgh (Philosophy) at 9.45 years.
- The top 3 schools in terms of lowest average time to completion of degree are (1) SUNY at Binghamton at 5 years, (1) McMaster University at 5 years, and (1) Arizona State University at 5 years.
| School | Average of Time To Complete Degree Over Period |
| Claremont Graduate University | 10.00 |
| Syracuse University | 9.60 |
| University of Pittsburgh (Philosophy) | 9.45 |
| Johns Hopkins University | 9.00 |
| University of Illinois at Chicago | 8.80 |
| DePaul University | 8.63 |
| University of Wisconsin-Madison | 8.60 |
| Indiana University-Bloomington | 8.36 |
| Catholic University of America | 8.03 |
| University of California, Berkeley | 7.97 |
| Fordham University | 7.88 |
| Vanderbilt University | 7.86 |
| Indiana University (HPS) | 7.83 |
| University of Utah | 7.80 |
| University of Notre Dame | 7.76 |
| University of Illinois at Urbana-Champaign | 7.70 |
| University of California-Los Angeles | 7.59 |
| Bowling Green State University-Main Campus | 7.50 |
| University of Dallas | 7.50 |
| University of Georgia | 7.50 |
| Duke University | 7.42 |
| Duquesne University | 7.40 |
| University of Miami | 7.40 |
| University of Texas at Austin | 7.38 |
| William Marsh Rice University | 7.25 |
| University of California-Santa Barbara | 7.21 |
| University of Arizona | 7.20 |
| University of Pittsburgh (HPS) | 7.20 |
| University of Rochester | 7.20 |
| Washington University in St. Louis | 7.20 |
| Boston College | 7.16 |
| Stony Brook University | 7.10 |
| Pennsylvania State University-Main Campus | 7.09 |
| The Ohio State University-Main Campus | 7.05 |
| Boston University | 7.00 |
| University of Hawaii at Manoa | 7.00 |
| University of California-Davis | 6.99 |
| Average | 6.94 |
| Michigan State University | 6.80 |
| University of Southern California | 6.71 |
| Purdue University-West Lafayette | 6.70 |
| Loyola University Chicago | 6.63 |
| University of Tennessee-Knoxville | 6.58 |
| Dalhousie University | 6.55 |
| Emory University | 6.50 |
| New York University | 6.50 |
| University of California-San Diego | 6.40 |
| University of Nebraska-Lincoln | 6.40 |
| University of California-Riverside | 6.30 |
| Princeton University | 6.29 |
| University of Massachusetts Amherst | 6.20 |
| University of South Florida-Main Campus | 6.19 |
| Cornell University | 6.18 |
| University of Virginia-Main Campus | 6.10 |
| University of Michigan-Ann Arbor | 6.02 |
| Temple University | 6.00 |
| Texas A & M University | 6.00 |
| University of California-Santa Cruz | 6.00 |
| University of Cincinnati-Main Campus | 6.00 |
| Stanford University | 5.94 |
| Saint Louis University-Main Campus | 5.83 |
| Massachusetts Institute of Technology | 5.70 |
| Southern Illinois University Carbondale | 5.70 |
| Carnegie Mellon University | 5.69 |
| University of Washington-Seattle Campus | 5.68 |
| University of Oklahoma Norman Campus | 5.24 |
| Rutgers University-New Brunswick | 5.20 |
| Arizona State University | 5.00 |
| McMaster University | 5.00 |
| SUNY at Binghamton | 5.00 |
Here is the aggregation of schools over the 5 year period:
| Year | Average of Time To Complete |
| 2009 | 6.827540984 |
| 2010 | 7.066060606 |
| 2011 | 6.936119403 |
| 2012 | 7.021967213 |
| 2013 | 6.812586207 |
Graphically:
Further Information
Visit our other reports on the APA 2013 Graduate Guide’s data
- APA 2013 Graduate Guide: Faculty
- APA 2013 Graduate Guide: Placements from PhD Programs
- APA 2013 Graduate Guide: Placements from MA Programs
Visit our other philosophy placement reports based on each school’s placement data
![]() Graduate Student Philosophy Placement Records
Graduate Student Philosophy Placement Records
![]() The Continental Philosophy Report
The Continental Philosophy Report
If you have any suggestions about how to make this report better, or would like to report updates to the APA Graduate Guide to include in this report, please send me an email. Also, contact the APA directly for more information about this data.
Thanks,
We’d like to thank Amy E. Ferrer, Executive Director, The American Philosophical Association, University of Delaware, for approving the use of this data, providing useful feedback, and for approving these reports for publication.


